MySQL Indexing Strategies Every Laravel Developer Should Know
Every Laravel application has slow queries. The question is whether you find them before your users do.
A query that takes 50ms on your local machine with 100 rows might take 5 seconds in production with 500,000 rows. A polymorphic relationship that works fine in development becomes a full table scan when the morphables table hits a million records. An Eloquent scope that chains three whereHas calls generates a nested subquery monster that brings your database server to its knees during peak traffic.
The good news: Laravel gives you excellent tools to find these queries before they cause outages. The better news: once you find them, the fixes are usually straightforward. This post walks through a complete workflow — from local detection with Debugbar and Telescope, through query analysis with EXPLAIN, to production monitoring with Deploynix.
Step 1: Detect Slow Queries in Development
The first line of defense is catching slow queries during development. Two tools make this effortless.
Laravel Debugbar
Debugbar is the fastest way to spot query problems. Install it as a dev dependency:
composer require barryvdh/laravel-debugbar --devEvery page load shows a toolbar at the bottom of your browser with the number of queries executed and their total time. Click the queries tab to see each individual query with its execution time and the file/line that triggered it.
The critical metric here isn't the total query time — it's the query count. If loading a dashboard page executes 47 queries, you have an N+1 problem regardless of how fast each individual query runs. Those 47 queries will become 4,700 queries when your data grows.
Look for these red flags in Debugbar:
More than 10-15 queries per page load
Duplicate queries (the same query executed multiple times with different IDs)
Queries without a
WHEREclause on large tablesQueries that don't appear in your controller or view code (often caused by lazy-loaded relationships in Blade templates)
Laravel Telescope
Telescope records every query your application executes and flags slow ones automatically. After installation, visit /telescope/queries to see queries sorted by duration.
Telescope is particularly useful for catching slow queries in API endpoints and queued jobs — places where Debugbar can't reach.
Configure the slow query threshold in your Telescope service provider:
Telescope::tag(function (IncomingEntry $entry) {
    if ($entry->type === EntryType::QUERY && $entry->content['slow']) {
        return ['slow-query'];
    }

    return [];
});
The default slow query threshold is 100ms, which is reasonable for most applications. Any query that takes longer than that deserves investigation.
Step 2: Analyze with EXPLAIN
Once you've identified a slow query, the next step is understanding why it's slow. MySQL's EXPLAIN command tells you exactly how the database plans to execute a query.
Take the raw SQL from Debugbar or Telescope and run it with EXPLAIN:
EXPLAIN SELECT * FROM orders
WHERE user_id = 42
AND status = 'pending'
AND created_at > '2026-01-01'
ORDER BY created_at DESC;
The output shows you the query execution plan. Here's what to look for:
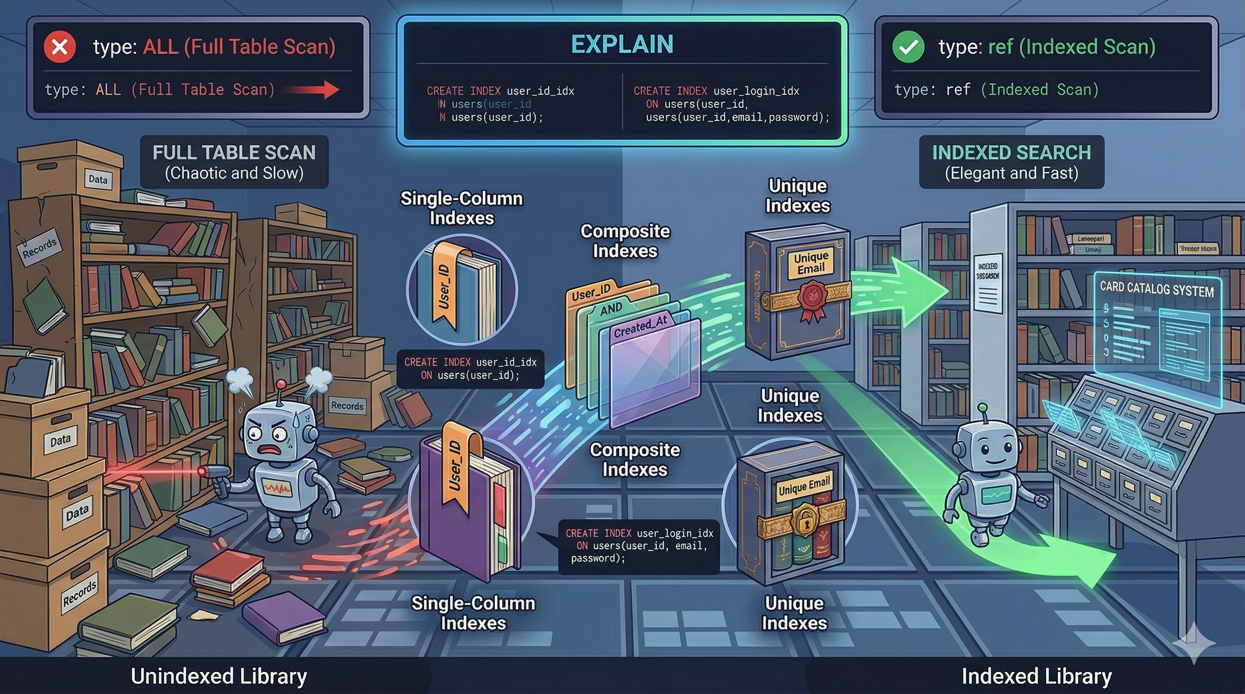
type column: This is the most important indicator.
ALLmeans a full table scan. On a large table, this is almost always the problem.indexmeans a full index scan — better than ALL, but still reads every row in the index.rangemeans the query uses an index to select a range of rows. This is usually acceptable.refmeans the query uses an index to look up matching rows. This is good.eq_refmeans a unique index lookup. This is optimal.constmeans the query matches at most one row. This is the fastest possible lookup.
rows column: The estimated number of rows MySQL will examine. If this number is close to the total row count of the table, you're doing a full scan even if the type column says otherwise.
Extra column: Watch for "Using filesort" (MySQL has to sort results without an index) and "Using temporary" (MySQL creates a temporary table). Both indicate potential performance problems on large datasets.
Running EXPLAIN from Laravel
You can use Eloquent's toSql() method to get the raw SQL, then run EXPLAIN through a database client. Or use the query builder's explain() method directly:
$results = Order::query()
    ->where('user_id', 42)
    ->where('status', 'pending')
    ->where('created_at', '>', '2026-01-01')
    ->orderByDesc('created_at')
    ->explain()
    ->get();
This returns the EXPLAIN output as a collection you can inspect or log.
Step 3: Common Slow Query Patterns and Fixes
Pattern 1: Missing Index on WHERE Columns
The problem:
Order::where('status', 'pending')->get();Without an index on status, MySQL scans every row in the orders table.
The fix:
// Create a migration
Schema::table('orders', function (Blueprint $table) {
    $table->index('status');
});
Pattern 2: Composite WHERE Without a Composite Index
The problem:
Order::where('user_id', $userId)
    ->where('status', 'pending')
    ->orderByDesc('created_at')
    ->get();
Even with individual indexes on user_id, status, and created_at, MySQL can only use one index per table in a simple query. It picks the most selective one and scans the rest.
The fix:
Create a composite index that covers all three columns in the correct order:
Schema::table('orders', function (Blueprint $table) {
    $table->index(['user_id', 'status', 'created_at']);
});
Column order matters. Put equality conditions (user_id, status) before range conditions (created_at) and sort columns.
Pattern 3: Using whereHas with Complex Conditions
The problem:
Product::whereHas('reviews', function ($query) {
    $query->where('rating', '>=', 4);
})->get();
whereHas generates a correlated subquery that MySQL executes once per row in the outer table. On large tables, this is devastating.
The fix:
Use a JOIN instead:
Product::select('products.*')
    ->join('reviews', 'products.id', '=', 'reviews.product_id')
    ->where('reviews.rating', '>=', 4)
    ->distinct()
    ->get();
Or denormalize the data by adding a reviews_avg_rating column to the products table and updating it through an observer or event listener.
Pattern 4: Sorting Without an Index
The problem:
Post::where('published', true)
    ->orderByDesc('views_count')
    ->paginate(20);
If there's no index covering both the WHERE and ORDER BY columns, MySQL fetches all matching rows, then sorts them in memory. The "Using filesort" flag in EXPLAIN confirms this.
The fix:
Schema::table('posts', function (Blueprint $table) {
    $table->index(['published', 'views_count']);
});
Pattern 5: Selecting All Columns When You Need Few
The problem:
$users = User::all();
// Then in a Blade view:
@foreach($users as $user)
    {{ $user->name }}
@endforeach
You're loading every column (including potentially large text fields, JSON columns, and binary data) when you only need the name.
The fix:
$users = User::select(['id', 'name'])->get();This reduces memory usage and network transfer between the database and application server. On tables with large text or json columns, the difference can be dramatic.
Pattern 6: Unbounded Queries
The problem:
$logs = ActivityLog::where('user_id', $userId)->get();If a user has 50,000 activity log entries, this loads all 50,000 into memory at once.
The fix:
Use pagination or chunking:
// For display
$logs = ActivityLog::where('user_id', $userId)
    ->latest()
    ->paginate(25);

// For processing
ActivityLog::where('user_id', $userId)
    ->chunkById(500, function ($logs) {
        // Process 500 at a time
    });
Step 4: Prevent Regressions with Automated Detection
Laravel 12 lets you prevent lazy loading application-wide, turning N+1 problems into exceptions during development:
// bootstrap/app.php or a service provider
Model::preventLazyLoading(! app()->isProduction());
In production, you don't want exceptions crashing pages. Instead, log lazy loading violations:
Model::preventLazyLoading();

Model::handleLazyLoadingViolationUsing(function ($model, $relation) {
    $class = get_class($model);
    logger()->warning("Lazy loading [{$relation}] on model [{$class}].");
});
This gives you a log trail of N+1 problems to fix without disrupting users.
Step 5: Monitor Queries in Production with Deploynix
Development testing only goes so far. Your local database has a fraction of the data, the server has different resources, and traffic patterns create contention you can't simulate easily.
Deploynix's server monitoring tracks your MySQL process's CPU and memory usage in real-time. When a slow query starts consuming resources, you'll see it reflected in the database server's metrics before it causes user-facing issues.
Set up health alerts on your database server to notify you when MySQL CPU usage exceeds 80% for more than 5 minutes. This gives you a window to investigate before the query brings the server down.
Combine Deploynix's infrastructure monitoring with Laravel Pulse's slow query tracking in production. Pulse tells you which queries are slow. Deploynix tells you whether those slow queries are actually impacting server resources. A query that takes 500ms but runs twice a day is a low priority fix. A query that takes 200ms but runs 10,000 times per hour is an emergency — and Deploynix's CPU graphs will make that obvious.
Step 6: Establish a Query Performance Budget
Set concrete thresholds for your team:
Page load queries: Maximum 15 queries per page load
API endpoint queries: Maximum 10 queries per request
Individual query time: No single query over 100ms in development
Total query time per request: Under 50ms for 95% of requests
Enforce these through automated testing:
it('loads the dashboard in under 15 queries', function () {
    $user = User::factory()->create();

    $queryCount = 0;
    DB::listen(function () use (&$queryCount) {
        $queryCount++;
    });

    $this->actingAs($user)
        ->get('/dashboard')
        ->assertOk();

    expect($queryCount)->toBeLessThan(15);
});
This test fails when someone introduces an N+1 problem on the dashboard, catching it before code review.
Conclusion
Slow queries are inevitable as your application grows. What's not inevitable is letting them reach production undetected.
Use Debugbar and Telescope to catch problems during development. Analyze suspicious queries with EXPLAIN to understand exactly why they're slow. Apply the common fixes — proper indexing, eager loading, query restructuring. Prevent regressions with preventLazyLoading and query count tests. And monitor production with Deploynix to catch the queries that only become problems at scale.
The developers who deploy confidently aren't the ones who write perfect queries. They're the ones who have systems in place to find and fix imperfect queries before users feel the pain.