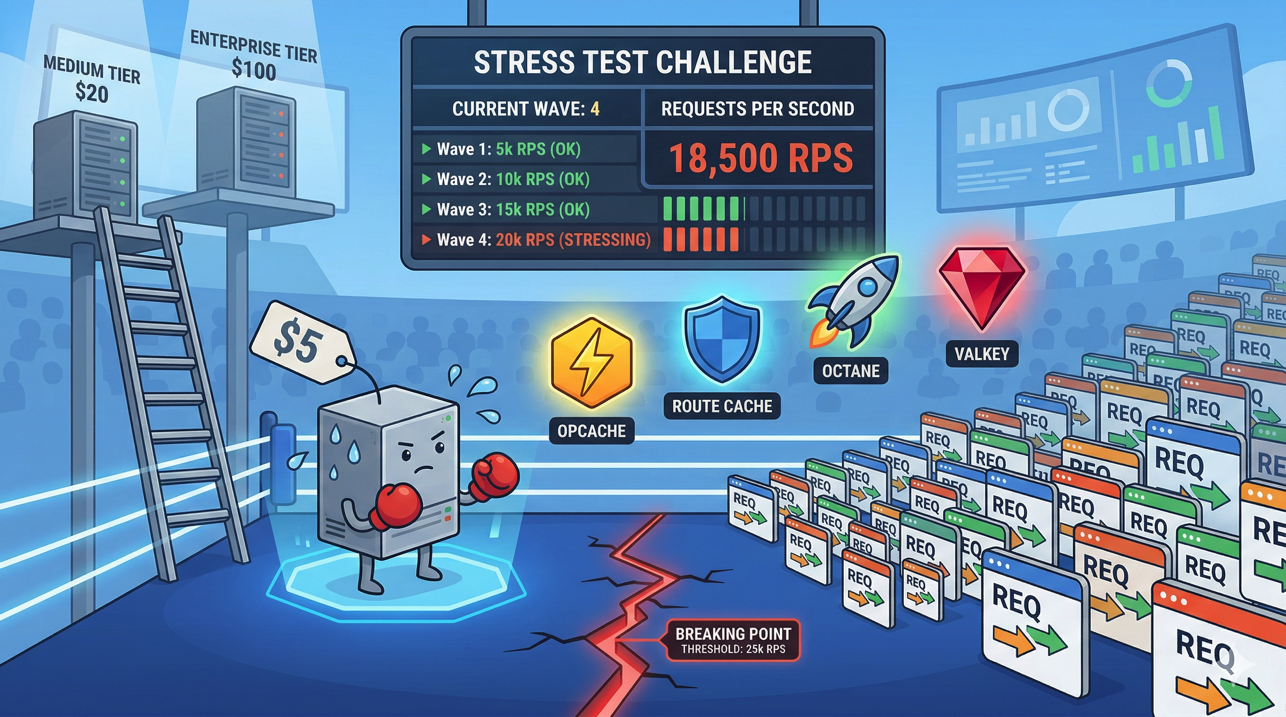
How Much Traffic Can a $5 Server Handle? Load Testing Laravel on Deploynix
Every developer launching a new project asks the same question: how much server do I actually need? The cloud providers offer servers starting at $4-6/month, but their marketing pages show theoretical bandwidth limits and CPU benchmarks that tell you nothing about how your Laravel application will perform under real-world load.
So let's find out. In this post, we'll provision a $5 server on Deploynix, deploy a representative Laravel application, and progressively load test it until it breaks. Along the way, we'll apply optimizations and measure their impact. By the end, you'll know exactly what a budget server can handle — and when it's time to scale up.
The Test Environment
The Server
We're using a typical $5/month cloud server — the kind you'd get from Hetzner, DigitalOcean, or Vultr at this price point:
CPU: 1 shared vCPU
RAM: 1 GB
Disk: 25 GB SSD
Network: 1 Gbps
OS: Ubuntu 24.04
This is the smallest server most providers offer. Deploynix provisions it as an App server — running Nginx, PHP 8.4 with FPM, MySQL, Valkey, and Supervisor all on the same machine.
The Application
Testing against a "Hello World" endpoint is meaningless. Real Laravel applications hit the database, render Blade views, check authentication, and process middleware. Our test application represents a typical content site:
Authentication middleware on all routes
A dashboard page that queries 5 Eloquent models with relationships
A listing page with pagination (20 items per page, eager-loaded relationships)
An API endpoint returning JSON through an Eloquent Resource
Active sessions stored in Valkey
Config, route, and view caches enabled
This gives us a realistic baseline that reflects what most Laravel applications actually do.
The Load Testing Tool
We'll use k6, a modern load testing tool that's developer-friendly and doesn't consume excessive resources on the machine running the tests. A basic k6 script looks like this:
import http from 'k6/http';
import { check, sleep } from 'k6';

export const options = {
    stages: [
        { duration: '1m', target: 10 },   // Ramp to 10 users
        { duration: '3m', target: 10 },   // Stay at 10
        { duration: '1m', target: 50 },   // Ramp to 50
        { duration: '3m', target: 50 },   // Stay at 50
        { duration: '1m', target: 100 },  // Ramp to 100
        { duration: '3m', target: 100 },  // Stay at 100
        { duration: '1m', target: 0 },    // Ramp down
    ],
};

export default function () {
    const res = http.get('https://your-app.deploynix.cloud/dashboard');
    check(res, {
        'status is 200': (r) => r.status === 200,
        'response time < 500ms': (r) => r.timings.duration < 500,
    });
    sleep(1);
}
Run tests from a separate machine — never from the server you're testing. Loading testing from the same server contaminates results because the test tool competes with the application for resources.
Phase 1: Baseline Test (No Optimization)
First, let's deploy the application with default settings — no caching commands, no optimization. This represents what happens when a developer pushes code and forgets to run the optimization commands.
10 Concurrent Users
At 10 concurrent users with a 1-second think time (each user makes a request, waits 1 second, repeats):
Requests/second: ~9.5
Median response time: 95ms
P95 response time: 180ms
P99 response time: 310ms
Error rate: 0%
CPU usage: ~25%
Memory usage: ~680MB (of 1GB)
At this level, the server handles everything comfortably. Response times are good, and there's plenty of headroom.
50 Concurrent Users
Ramping to 50 concurrent users:
Requests/second: ~42
Median response time: 320ms
P95 response time: 890ms
P99 response time: 1,400ms
Error rate: 0%
CPU usage: ~78%
Memory usage: ~720MB
Things are getting warm. The P95 response time approaching 1 second means one in twenty requests feels sluggish. CPU is climbing. Memory is tight — MySQL and Valkey are competing with PHP workers for that 1GB.
100 Concurrent Users
Pushing to 100:
Requests/second: ~48 (barely increased from 50 users)
Median response time: 1,800ms
P95 response time: 4,200ms
P99 response time: 8,500ms
Error rate: 3.2% (timeouts and 502 errors)
CPU usage: 98%
Memory usage: ~950MB (OOM killer territory)
The server hit its wall. Request throughput plateaued at ~48 req/s while response times exploded. Some requests are timing out entirely. The CPU is saturated, and memory is dangerously close to triggering the OOM killer.
Baseline breaking point: ~50 concurrent users, ~42 requests/second.
Phase 2: Apply Laravel Optimizations
Now let's apply the standard production optimizations and retest.
php artisan config:cache
php artisan route:cache
php artisan view:cache
php artisan event:cache
Also ensure APP_DEBUG=false and the OPcache extension is enabled (Deploynix enables this by default).
Results at 50 Concurrent Users (Optimized)
Requests/second: ~48
Median response time: 210ms
P95 response time: 450ms
P99 response time: 680ms
Error rate: 0%
CPU usage: ~60%
Memory usage: ~650MB
A significant improvement. Caching configuration and routes eliminated the overhead of parsing those files on every request. Response times nearly halved, and CPU dropped from 78% to 60%.
Results at 100 Concurrent Users (Optimized)
Requests/second: ~82
Median response time: 480ms
P95 response time: 1,100ms
P99 response time: 1,800ms
Error rate: 0.5%
CPU usage: 92%
Memory usage: ~780MB
We nearly doubled the throughput before hitting the wall. The server can now handle 100 concurrent users with acceptable (though not great) response times. The few errors are sporadic timeouts during CPU spikes.
Optimized breaking point: ~100 concurrent users, ~82 requests/second.
Phase 3: Switch to FrankenPHP (Octane)
FrankenPHP keeps the Laravel application bootstrapped in memory between requests. Instead of loading the framework, service providers, and configuration on every request, the application boots once and handles subsequent requests from memory.
Deploy with FrankenPHP through Deploynix's Octane driver selection, then retest.
Results at 100 Concurrent Users (FrankenPHP)
Requests/second: ~145
Median response time: 180ms
P95 response time: 420ms
P99 response time: 690ms
Error rate: 0%
CPU usage: ~70%
Memory usage: ~520MB
This is a dramatic improvement. FrankenPHP eliminated the per-request framework bootstrap overhead, nearly doubling throughput again. Memory usage actually dropped because the application is loaded once instead of per-request.
Results at 200 Concurrent Users (FrankenPHP)
Requests/second: ~180
Median response time: 450ms
P95 response time: 1,100ms
P99 response time: 1,900ms
Error rate: 0.8%
CPU usage: 94%
Memory usage: ~600MB
At 200 concurrent users, the single vCPU is the bottleneck. The application is still responsive but the CPU can't keep up. Throughput has started to plateau.
FrankenPHP breaking point: ~200 concurrent users, ~180 requests/second.
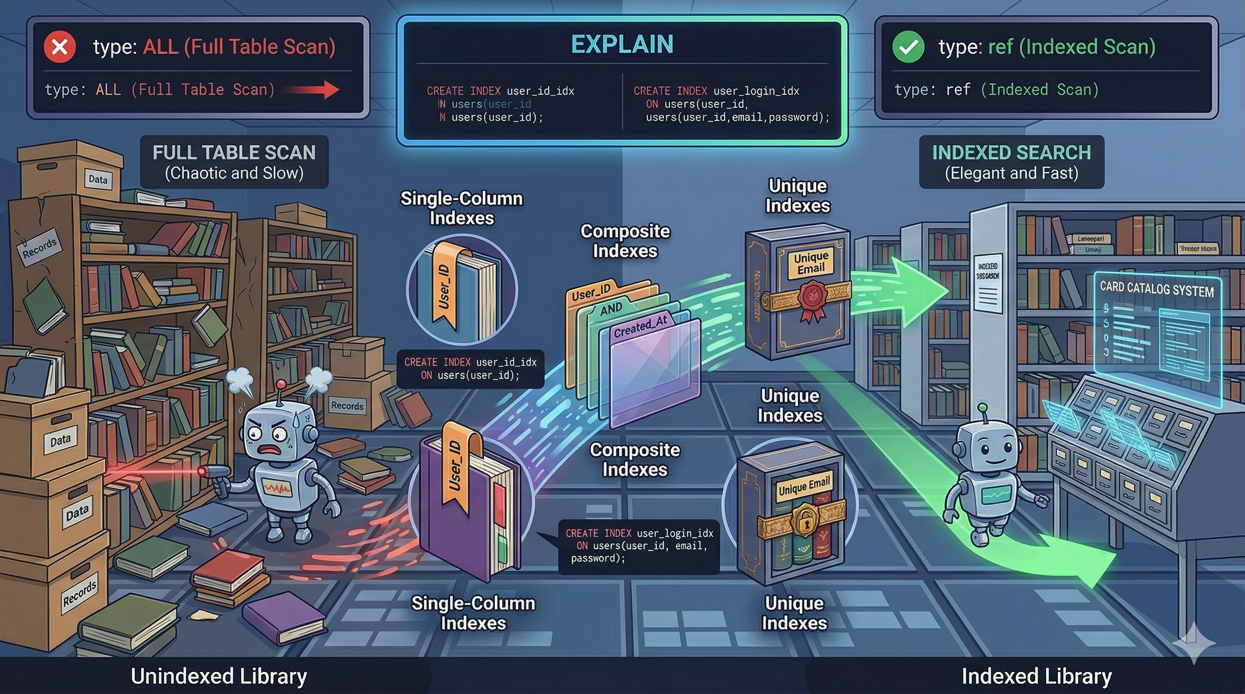
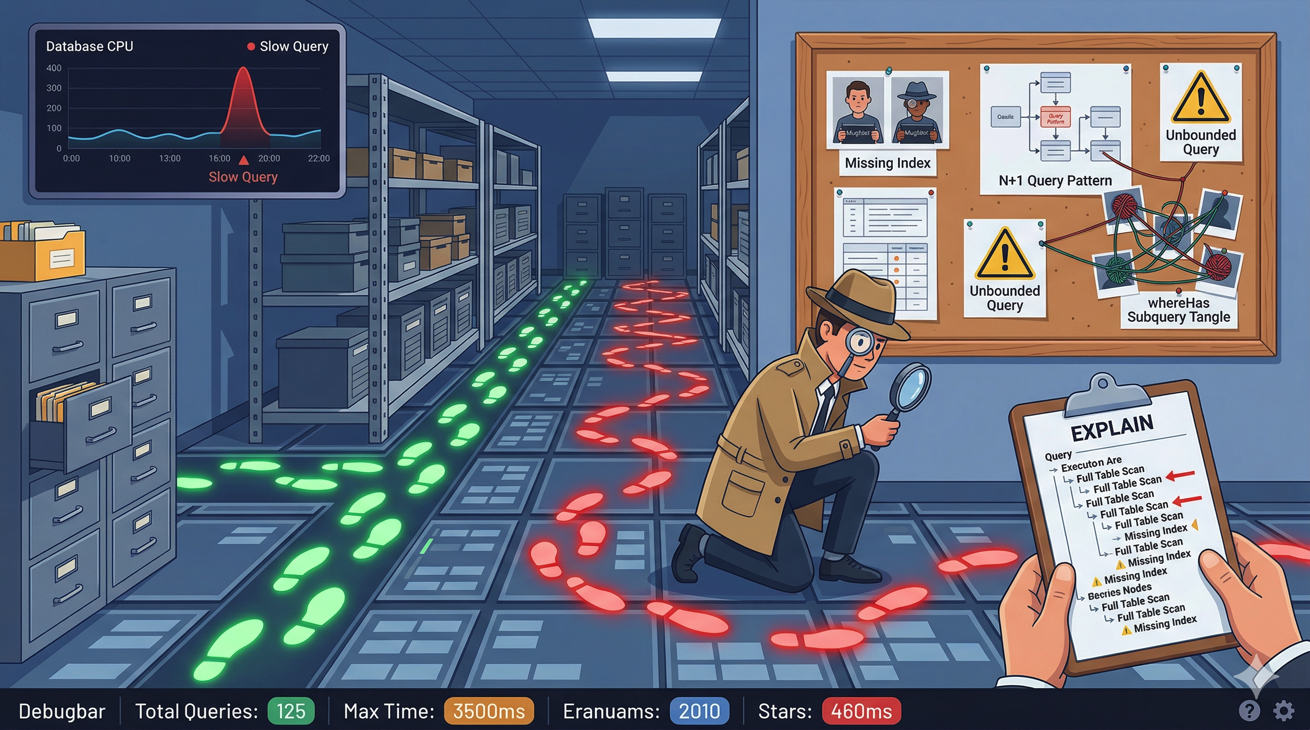
Phase 4: Database Query Optimization
Our test application had a few unoptimized queries — missing eager loading on the listing page and no indexes on commonly filtered columns. After fixing:
// Before: N+1 problem
$posts = Post::paginate(20);
// In view: $post->author->name (triggers N+1)

// After: Eager loaded
$posts = Post::with('author')->paginate(20);
And adding a composite index:
Schema::table('posts', function (Blueprint $table) {
    $table->index(['status', 'published_at']);
});
Results at 200 Concurrent Users (FrankenPHP + Query Optimization)
Requests/second: ~210
Median response time: 380ms
P95 response time: 820ms
P99 response time: 1,300ms
Error rate: 0%
CPU usage: 88%
Memory usage: ~550MB
Query optimization reduced database CPU time, which freed up CPU cycles for handling more requests. The errors at 200 users disappeared entirely.
Pushing to 300 Concurrent Users
Requests/second: ~225
Median response time: 850ms
P95 response time: 2,100ms
P99 response time: 3,400ms
Error rate: 1.5%
CPU usage: 98%
Memory usage: ~620MB
The CPU is fully saturated. We've found the ceiling for this $5 server.
Fully optimized breaking point: ~250 concurrent users, ~220 requests/second.
What Does This Mean in Real Traffic?
Concurrent users is a load testing metric, not a real-world traffic metric. Real users don't send a request every second — they read pages, fill out forms, and navigate at human speed. The ratio depends on your application, but a common rule of thumb:
1 concurrent user in load testing ≈ 10-30 real active users.
So our fully optimized $5 server handling 250 concurrent users translates to roughly:
2,500 - 7,500 active users browsing simultaneously
~220 requests/second sustained throughput
~19 million requests/day at sustained peak
~570 million requests/month at sustained peak
Most applications don't sustain peak traffic 24/7. If your peak is 4 hours/day, a $5 server can handle an application with 50,000-100,000 daily active users comfortably.
That's a $5/month server.
Optimization Impact Summary
Configuration | Max RPS | P95 at 50 Users | Breaking Point |
|---|---|---|---|
Default (no caching) | ~42 | 890ms | ~50 concurrent |
Laravel cache commands | ~82 | 450ms | ~100 concurrent |
FrankenPHP (Octane) | ~180 | 420ms | ~200 concurrent |
+ Query optimization | ~220 | 320ms | ~250 concurrent |
Each optimization roughly doubled throughput. Combined, we went from 42 to 220 requests/second — a 5x improvement without spending an extra dollar on infrastructure.
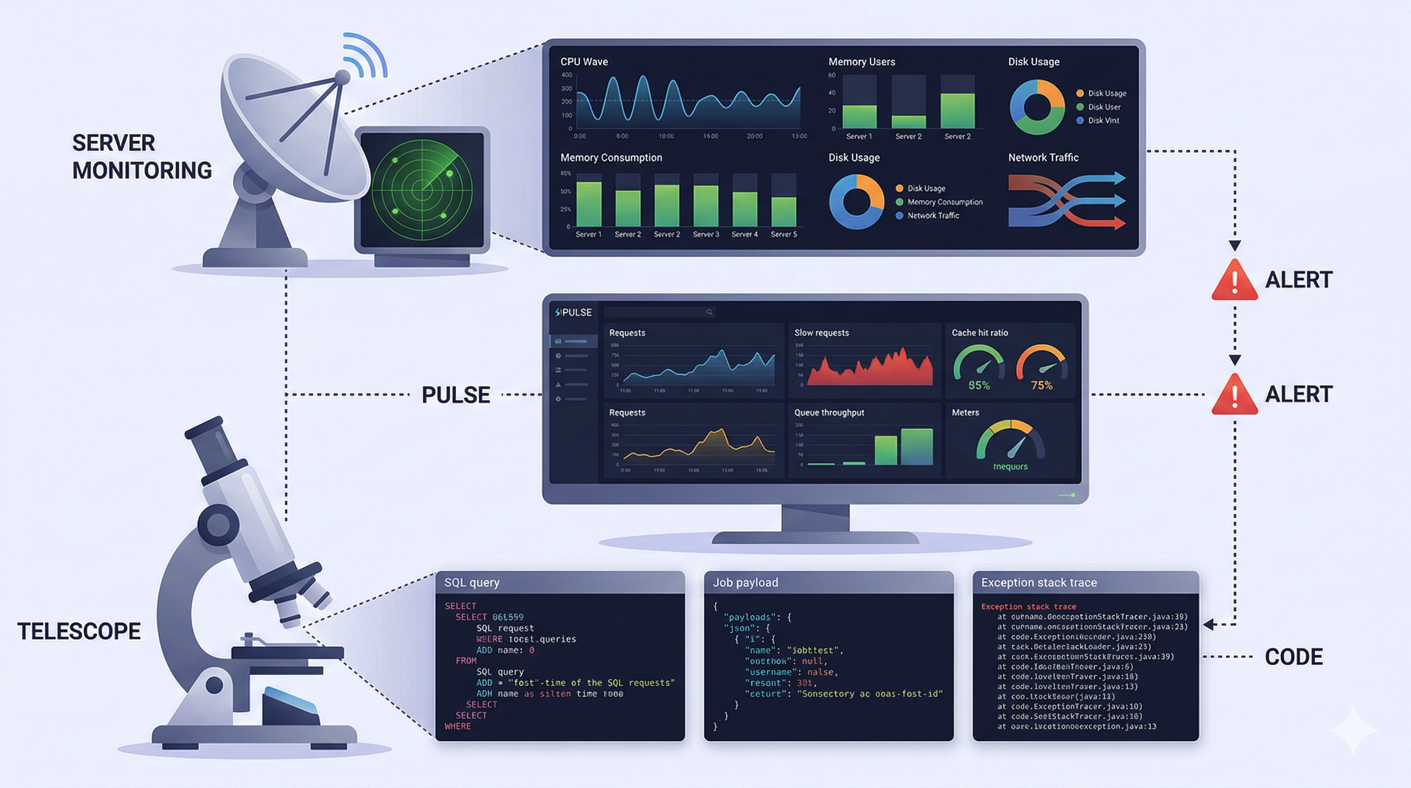
When to Scale Up
Watch these signals on your Deploynix monitoring dashboard:
Scale up the server (vertical scaling) when:
CPU consistently above 80% during normal traffic (not just spikes)
Memory usage leaves less than 100MB free
P95 response times exceed your acceptable threshold (usually 1-2 seconds)
The OOM killer has been triggered (check
dmesgfor killed processes)
Scale out to multiple servers (horizontal scaling) when:
You've maxed out the largest single server your budget allows
You need redundancy — a single server is a single point of failure
Queue processing competes with web requests for CPU time
Database operations need dedicated resources
The typical scaling path on Deploynix:
Start with a single App server ($5-12/month)
Upgrade to a larger server when CPU/memory is consistently tight ($24-48/month)
Separate the database to its own server when query performance suffers
Add a dedicated worker server when queues can't keep up
Add a load balancer with multiple web servers when a single web server can't handle peak traffic
Cost-Effective Optimization Checklist
Before spending money on bigger servers, make sure you've applied these free optimizations:
[ ]
APP_DEBUG=false[ ] Run
config:cache,route:cache,view:cache,event:cache[ ] OPcache enabled with appropriate settings
[ ] FrankenPHP, Swoole, or RoadRunner via Octane
[ ] Eager loading on all relationship accesses (no N+1 queries)
[ ] Database indexes on filtered and sorted columns
[ ] Response caching for pages that don't change per-user
[ ] Asset optimization (
npm run build, notnpm run dev)[ ] Queue heavy operations instead of processing inline
[ ] Valkey for sessions, cache, and queues (not file/database drivers)
Each of these is free and most take minutes to implement. Collectively, they can improve performance by 5-10x.
Conclusion
A $5 server can handle far more traffic than most developers expect. With Laravel's built-in optimization commands and an Octane driver like FrankenPHP, a single shared vCPU server sustains over 200 requests per second — enough for thousands of concurrent users.
The key insight is that optimization should come before scaling. A $5 server with FrankenPHP and proper caching outperforms a $48 server running unoptimized PHP-FPM. Only when you've exhausted the free optimizations should you reach for the scaling lever.
Deploynix makes both paths easy. Optimize your application and deploy it to a small server. Monitor the metrics. When the dashboard tells you it's time, scale up with a click. No premature infrastructure spending, no guessing — just data-driven decisions about when your application needs more resources.
Start small. Optimize first. Scale when the numbers tell you to.