Laravel Telescope vs Pulse vs Nightwatch (2026): Which Should You Use?

Laravel now ships three first-party tools for looking inside your app — and they're easy to confuse. Telescope, Pulse, and Nightwatch all "monitor" something, but they solve different problems, run in different places, and only one of them costs money. Picking the wrong one means either flying blind in production or paying for observability you don't need yet.
Here's the short version: they're complementary, not competitors. Telescope is for local debugging, Pulse is a self-hosted production dashboard, and Nightwatch is hosted, full-fidelity production observability. Most serious apps end up running Telescope locally plus either Pulse or Nightwatch (or both) in production. This guide breaks down exactly what each does, what it costs, and how to choose.
Key takeaways
- Telescope = local debugging. Self-hosted, free (MIT), stores every request in your app database. Not built for production. - Pulse = self-hosted production dashboard. Free (MIT), shows aggregated metrics (slow queries, jobs, exceptions, server load). - Nightwatch = hosted SaaS observability. Keeps every event with tracing, alerts, and an exception-to-issue workflow. Free tier (300k events/mo), then $20–$300+/mo. - They stack: debug locally with Telescope, watch production with Pulse and/or Nightwatch. - Nightwatch pricing changed once since its June 2025 launch — always confirm current numbers on the official pricing page.
What's the difference between Telescope, Pulse, and Nightwatch?
The cleanest way to understand the three is on two axes: where they run (local vs production) and what they record (every individual event vs aggregated metrics).
Where it shines | Data model | Hosting | Cost | |
|---|---|---|---|---|
Telescope | Local development | Every event, full single-request detail | Self-hosted (your app DB) | Free (MIT) |
Pulse | Production | Pre-aggregated metrics ("buckets") | Self-hosted (your DB) | Free (MIT) |
Nightwatch | Production | Every event, retained in the cloud | Hosted SaaS | Free tier, then paid |
Laravel's own framing says it best. From the Nightwatch announcement: "Telescope helps you debug locally. Pulse shows you aggregated metrics. Nightwatch gives you the full story of what's happening in production" (Laravel Blog, 2025). That single sentence is the decision tree. The rest of this article fills in the detail.
What is Laravel Telescope and when should you use it?
Telescope is the official debugging companion for your local Laravel environment. It records every request, query, job, exception, mail, notification, cache operation, scheduled task, and dump — then lets you drill into any single one with full context. The docs describe it as "a wonderful companion to your local Laravel development environment" (Laravel Docs).
Telescope stores its entries in your own application database, in a telescope_entries table created by its migrations. That's exactly why it's a local tool: on a busy production app, that table fills up fast. The docs are blunt about the trade-offs — you should schedule telescope:prune daily (it clears entries older than 24 hours by default), and the Nightwatch comparison page states plainly that Telescope is "not recommended for production environments."
You can run it in production behind an authorization gate, and some teams do for short-lived deep debugging. But its design intent is local. By default the dashboard is only reachable when APP_ENV is local; expose it elsewhere and you must add a gate, or the dashboard becomes publicly accessible.
It is very much alive — the latest release is v5.20.0 from April 2026, and it's MIT-licensed and free. Telescope's role just narrowed once Pulse and Nightwatch arrived: it owns the local-debugging niche, and the other two cover production.
Use Telescope when: you're developing locally and need to see exactly what a single request did — every query, the bindings, the timing, the exception stack. It's the fastest way to answer "why did this request behave that way?"
What is Laravel Pulse and how is it different from Telescope?
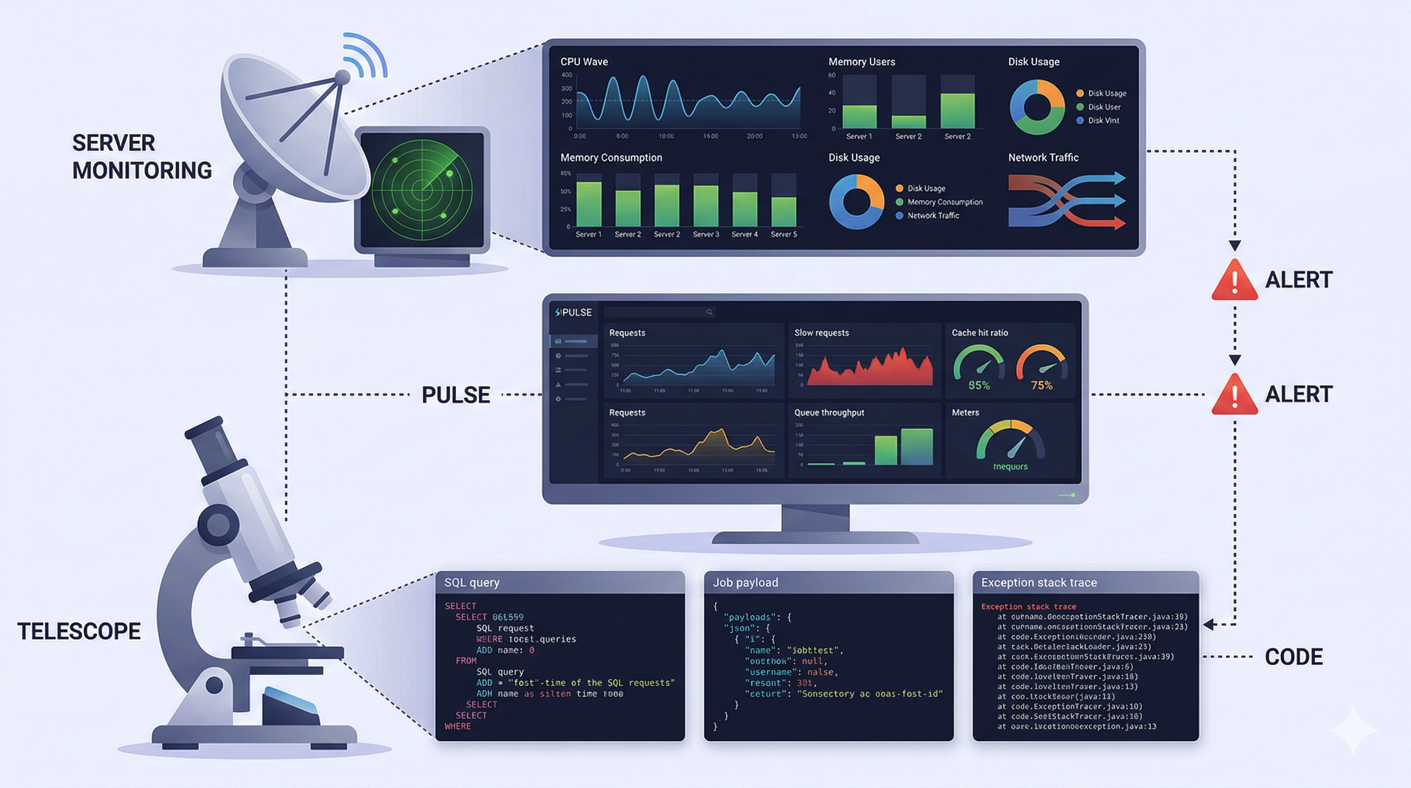
Pulse is a lightweight, self-hosted production dashboard that shows aggregated performance and usage at a glance. Where Telescope keeps every individual event, Pulse rolls data into pre-computed buckets — averages, counts, maxes — so it stays cheap to run even under real traffic. The Pulse docs draw the line explicitly: "For in-depth debugging of individual events, check out Laravel Telescope" (Laravel Docs).
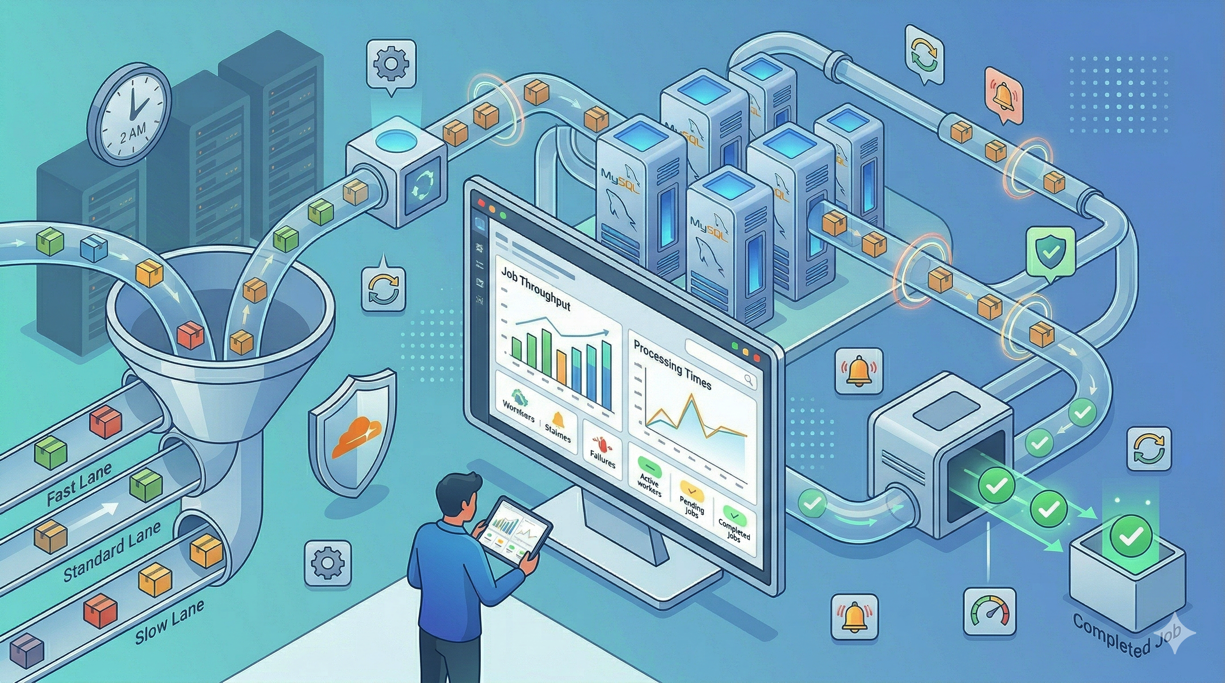
Out of the box, Pulse gives you cards for server health (CPU, memory, storage via pulse:check), top application usage, exceptions, queues, slow requests, slow jobs, slow queries, slow outgoing requests, and cache hit/miss rates. The default "slow" threshold is 1,000ms. The dashboard is a Livewire app served at /pulse, and like Telescope it's local-only by default — in production you add a viewPulse gate to control access.
The headline feature is that it "drops into an existing application without requiring any additional infrastructure." For low and medium traffic, it just writes to your existing database. As you scale, Pulse offers three levers to keep overhead down:
A dedicated database connection (
PULSE_DB_CONNECTION) so monitoring writes don't touch your primary.Redis ingest (run
pulse:work) to buffer captures instead of writing synchronously.Sampling — e.g. a sample rate of
0.1records roughly 10% of events and scales the numbers up.
Pulse also fails silently if a capture errors, so a monitoring hiccup never takes down your app. It's MIT-licensed, free, and stable (latest release v1.7.4, June 2026). One requirement to note: Pulse's first-party storage needs MySQL, MariaDB, or PostgreSQL.
Use Pulse when: you want production signal — what's slow, what's erroring, which users are hammering the app — without a SaaS bill, without sending your data off-site, and without new infrastructure. It answers "is my app healthy right now, and where are the bottlenecks?"
What is Laravel Nightwatch and what does it cost?
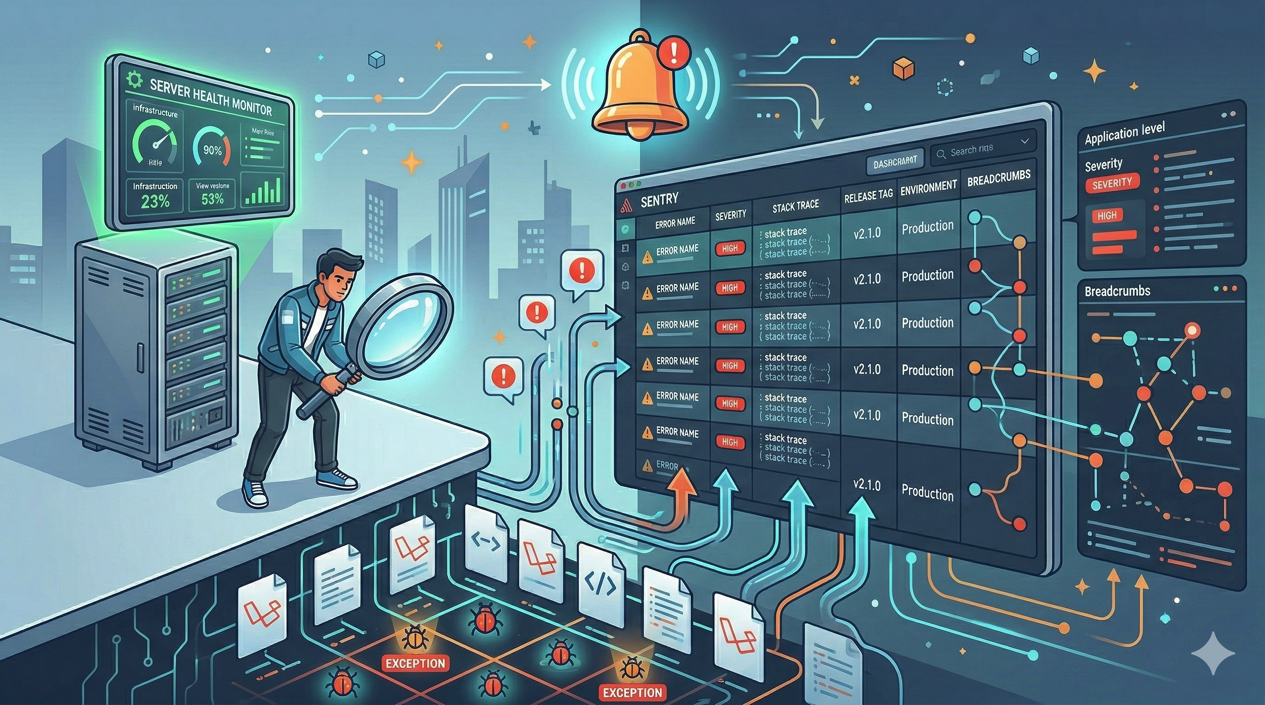
Nightwatch is Laravel's hosted observability platform, purpose-built for production. Unlike Telescope and Pulse, it's a managed SaaS: you install a package and a token, and an agent running out of process ships events to Nightwatch's cloud. Because the agent is separate from your app, the overhead is tiny — the docs cite "typically less than 3ms per request" (Nightwatch FAQ).
The big difference from Pulse is fidelity. Nightwatch keeps every individual event — requests, outgoing requests, jobs, queries, mail, commands, cache operations, scheduled tasks, notifications, and exceptions — not just aggregates. On top of that raw stream it layers the things a team actually needs in production:
Timelines and tracing for individual requests, queries, and jobs (middleware → controller → cache → query timing).
An exception-to-issue workflow — exceptions become trackable issues with assignment, priority, and status.
Smart alerts routed by issue type.
Per-user impact so you can see who a problem actually affected.
Team collaboration, which is a core selling point over the single-developer dashboards.
Data is stored in US, EU, or Australia regions, with a default retention of 90 days (the usable "lookback" window varies by plan). Nightwatch was announced at Laracon AU in November 2024 and went generally available on June 16, 2025 (Laravel News; Laravel Blog).
Nightwatch pricing (as of June 2026)
Plan | Price/mo | Events/mo included | Lookback | Overage per 100k | Performance monitors |
|---|---|---|---|---|---|
Free | $0 | 300,000 | 14 days | $0.50 | 1 |
Pro | $20 | 7.5M | 30 days | $0.35 | 10 |
Team | $60 | 30M | 60 days | $0.35 | 20 |
Business | $300 | 180M | 90 days | $0.20 | 30 |
Enterprise | Custom | — | — | — | — |
All plans include unlimited seats. Beyond your quota, you can opt in to additional event ingestion billed per 100k up to a limit you set, invoiced at the end of the cycle.
One important caveat: these numbers have already changed once since launch (the free tier was 200k events and Pro was 5M at GA; both went up). So treat the table above as a June 2026 snapshot and confirm the live figures on the official pricing page before you budget.
Use Nightwatch when: you're running real production traffic, you need to debug incidents after they happen (not just see that they happened), and a team needs to triage exceptions together with alerting. It answers "what exactly happened in production, to whom, and who's fixing it?"
Telescope vs Pulse vs Nightwatch: which should you choose?
Choose by where you are in the app's life and what question you're trying to answer:
Just developing locally? Telescope. Free, deep, instant.
App is in production, you want free insight and to keep data in-house? Pulse. Self-hosted aggregates, no bill, no external egress.
Production app where incidents cost money and a team responds to them? Nightwatch. Per-event tracing, alerts, and an issue workflow are worth paying for.
All of the above? Run all three. That's the intended setup.
Pulse and Nightwatch are the only two that genuinely overlap, both living in the production-monitoring space. The trade-off is straightforward: Pulse is free, self-hosted, and aggregated; Nightwatch is paid, hosted, and keeps every event with tracing and team features. Plenty of teams run Pulse for the always-on free dashboard and Nightwatch for deep incident analysis — they answer different questions.
How this fits a Deploynix deployment
Both self-hosted options run on the server you deploy to — which makes them a natural fit when you ship a Laravel app with Deploynix. Telescope rides along in your repo for local work and stays out of production behind its environment gate. Pulse runs on your production server with zero extra infrastructure, writing to the MySQL, MariaDB, or PostgreSQL database your stack already includes; add the pulse:check command to your scheduler for server metrics and a viewPulse gate so only your team can reach /pulse.
Nightwatch needs nothing from your server beyond the package and token, since its agent ships data to the cloud. Whichever you choose, wire the setup (migrations, the telescope:prune schedule, the pulse:work worker if you use Redis ingest) into your deploy hooks so monitoring is provisioned the same way every release.
Frequently asked questions
Can I run Telescope, Pulse, and Nightwatch at the same time?
Yes — they're designed to coexist, and Laravel's own documentation cross-references them. The common pattern is Telescope for local debugging, then Pulse and/or Nightwatch in production. Pulse and Nightwatch overlap, so many teams pick one as primary, but there's no technical conflict in running all three.
Is Laravel Telescope safe to use in production?
It's not recommended. Telescope stores every event in your application database, which grows quickly under real traffic, and its dashboard is only gated to local by default. You can enable it in production behind an authorization gate for short-term debugging, but Pulse or Nightwatch are the tools built for ongoing production monitoring.
Are Telescope and Pulse really free?
Yes. Both are open-source under the MIT license and cost nothing to use — you host them yourself on your own infrastructure. Your only "cost" is the database storage and minimal overhead they add. Nightwatch is the paid option, though it offers a free tier of 300,000 events per month.
What counts as an "event" in Nightwatch billing?
Nightwatch counts requests, outgoing requests, jobs, queries, mail, commands, cache operations, scheduled tasks, notifications, and exceptions as billable events. A single web request can generate several events (the request plus its queries and cache hits), so estimate your volume before choosing a plan, and use sampling to control it.
Does Pulse or Nightwatch slow down my app?
Both are built for low overhead. Pulse writes asynchronously, fails silently on capture errors, and supports Redis ingest plus sampling to stay light under load. Nightwatch runs its agent out of process and reports typically under 3ms of added latency per request. For high-traffic apps, sampling in either tool keeps the cost and overhead down.
The bottom line
There's no single winner here — the right answer depends on the question you're asking. Telescope is your local microscope. Pulse is your free, self-hosted production dashboard for spotting bottlenecks. Nightwatch is your hosted, full-fidelity production observability platform for when incidents matter and a team responds to them. Start with Telescope while you build, add Pulse the day you go live, and reach for Nightwatch when production traffic and team workflows justify it.
Whatever you run, the easiest place to operate it is on infrastructure you control. Deploy your Laravel app with Deploynix and wire Telescope, Pulse, or Nightwatch into your release process from day one.
---
Sources (retrieved 2026-06-18): Laravel Telescope docs, Laravel Pulse docs, Announcing Laravel Nightwatch — Laravel Blog, Nightwatch pricing, Nightwatch FAQs, Nightwatch vs Pulse, Laravel Nightwatch — Laravel News. Nightwatch pricing is a June 2026 snapshot and may change — verify on the official pricing page.